
A high Ct value paired with a low fluorescence signal often raises concerns during quantitative analysis. When discussing this scenario, it is important to focus on reaction conditions, probe behavior, and instrument sensitivity. In routine workflows, users frequently monitor the rise of fluorescence to determine target abundance, and a weak response can make interpretation difficult. At the same time, Synbio Technologies provides resources that help researchers understand how fluorophore performance and reaction environment influence detection efficiency. When a qPCR Probe Fluorescence Signal appears lower than expected, the underlying factors commonly include template quality, reaction inhibitors, suboptimal cycling conditions, or a mismatch between probe design and experimental parameters. These elements affect how the curve develops and why a delayed threshold may occur.
Factors Behind Low Fluorescence and High Ct Values
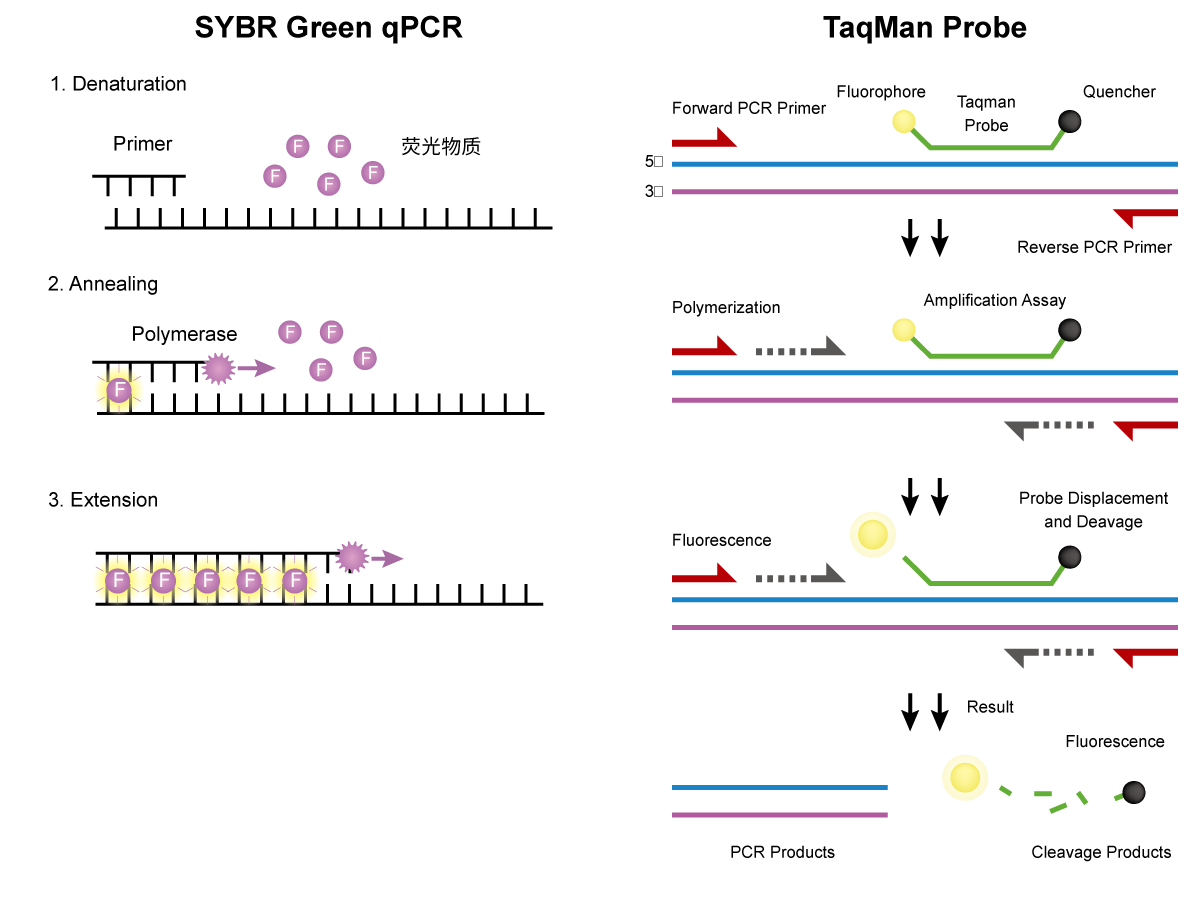
Several technical factors can contribute to limited amplification visibility. When the pcr fluorescence in the early cycles is insufficient, the signal may only exceed the threshold after a prolonged reaction, generating a high Ct. Template degradation, poor extraction, or inhibitors introduced during sample preparation can slow amplification efficiency. In some cases, probe quenching performance or fluorophore integrity may influence the emitted light intensity. They also highlight on their product information page that salt concentration, annealing conditions, probe sequence stability, and reaction balance directly shape the qPCR Probe Fluorescence Signal. These influences accumulate over cycles, leading to noticeable fluctuations in sensitivity and detection timing.
Another consideration is the thermocycler’s optical system. Even when a reaction proceeds appropriately, marginal light detection may cause the pcr fluorescence to appear lower than expected. Optical calibration, signal-to-noise ratio, and background correction are all parameters that can impact how the curve is interpreted. Reviewing these factors helps ensure the amplification curve reflects the true reaction performance rather than instrument variation.
Practical Approaches for Better Interpretation
When facing uncertain amplification data, researchers typically begin by comparing the curve shape, baseline stability, and amplification plateau. A curve with a delayed rise and weak fluorescence may still represent true low-abundance target detection, but confirmation steps are necessary. Running replicates, evaluating extraction consistency, and reviewing reaction setup can clarify whether the high Ct represents biological reality or technical interference. They also emphasize considerations related to probe design, such as fluorophore–quencher compatibility and sequence optimization, to support a stronger qPCR Probe Fluorescence Signal. Adjustments to reaction composition or thermocycling parameters may also improve the visibility of the fluorescence curve. Maintaining controlled handling practices, consistent reagent quality, and proper storage conditions further support reliable signal development.
Conclusion
Understanding how to interpret a high Ct with limited fluorescence requires examining both reaction biology and technical components. Reviewing template quality, probe design, reaction conditions, and detection system behavior can clarify whether the delayed Ct represents true low target levels or technical constraints affecting the qPCR Probe Fluorescence Signal. They provide detailed discussions on performance factors to help users evaluate signal behavior more confidently. By combining proper experimental setup with informed analysis, researchers can make reliable decisions when assessing pcr fluorescence patterns and draw accurate conclusions from qPCR data. Synbio Technologies supports these evaluations through clear explanations of probe performance factors and practical considerations.
